


What Is Data Analytics and How Is It Used in Modern Industries?
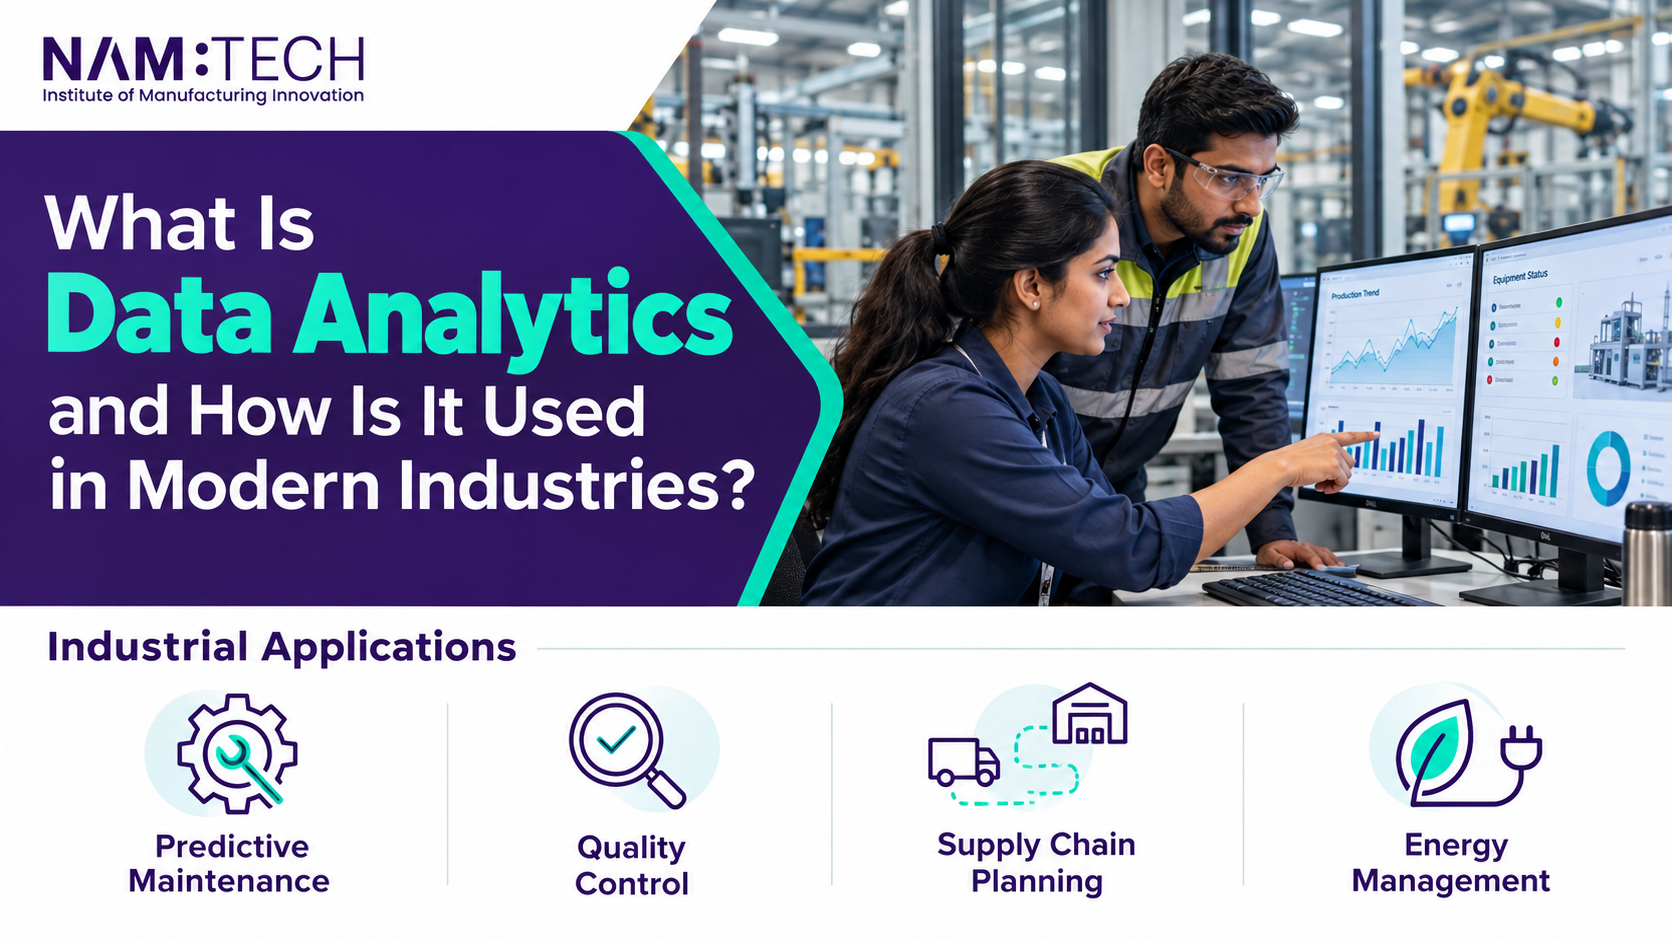
Open a food delivery app on a busy evening and it tells you the order will arrive in 25 minutes. That number is not a guess. It comes from data on past orders, distances, kitchen prep times and traffic, sorted and tested until the estimate is usually close. That is data analytics at work, and it sits behind far more of daily life than most students realise.
Data analytics is the process of collecting data, cleaning it, examining it and turning the results into a decision. Raw numbers rarely help on their own. A spreadsheet with a million sales rows tells nobody anything until someone asks it a sharp question. This article covers what analytics involves, where industries use it, and what a student should know before picking a study path.
What does a data analyst do all day?
The work is less mysterious than it sounds. It usually starts with a question, such as why sales dropped in March. The analyst then gathers data that might answer it, from databases, spreadsheets, apps or surveys. Next comes cleaning: fixing duplicates, filling gaps and sorting out dates typed five different ways. Only after that does the real analysis begin, followed by explaining the result to the people who make decisions.
Cleaning often eats a large share of the time, and students tend to underestimate it. A wrong figure in the raw data gives a wrong answer, however clever the method. Explaining matters just as much, and it is a skill you can practise. A manager who cannot follow a chart will not act on it.
What are the four types of data analytics?
Analysts commonly sort their work into four types, and each answers a different question.
Descriptive analytics says what happened. Monthly sales totals, website visits and exam pass rates are all descriptive. Diagnostic analytics asks why. If sales fell, the analyst splits the numbers by region, product and week to find where the drop began. Predictive analytics uses statistical models and machine learning to estimate what is likely to happen next, such as which customers may cancel a subscription. Prescriptive analytics goes a step further and suggests what to do, for example how an airline should price seats as a flight fills up.
Most organisations start with the first two and move on as their data and skills improve. Predictive and prescriptive work is harder because it needs more data, better tools and people who can check that a model is behaving. So a beginner does not have to start with machine learning. Descriptive and diagnostic skills are the base, and many entry-level analyst roles lean on them daily.
Where is data analytics used in industry?
Almost everywhere that records are kept.
Retailers use sales history, seasons and local events to decide how much stock each shop needs. Too little leaves empty shelves. Too much means discounts and waste. Banks watch card transactions for activity that does not fit a customer’s usual habits and flag it as possible fraud, and lenders use past repayment data to estimate how risky a loan is.
Hospitals study admission patterns to plan staff and beds, and researchers compare treatment results across large groups of patients. Privacy rules are strict in healthcare, so analysts there handle records with real care.
Delivery firms plan routes around distance, traffic and delivery windows, and a small saving on each route adds up over thousands of trips. Factories fit sensors to machines to record heat, vibration and output. A change in those readings can warn that a part is wearing out, so the repair can be planned instead of rushed.
What can data analytics not do?
It cannot fix bad data, and it cannot think for you. Models learn from the past, so they can fail when conditions change. Data can also be incomplete or biased without anyone noticing, which leads to unfair or plain wrong results.
The most common trap is mixing up correlation and cause. Say a shop finds that ice cream sales and sunburn cases rise together. Hot weather drives both. Ice cream does not cause sunburn. An analyst who spots that gap is worth far more than one who only produces charts.
Is the job market good for new analysts?
In the United States, employment of data scientists is projected to grow 34 per cent between 2024 and 2034, which the labour statistics office calls much faster than average. Data scientist is a close relative of the analyst role, not an identical one, and the figure is American. Other countries and cities will look different.
Job titles are also messy. “Analyst” can mean building weekly reports in one company and fitting statistical models in another. Read live job listings in the place you want to work, and note whether employers ask for a Master Program in Data Analytics or accept a degree plus projects.
What should a student learn first?
Start with spreadsheets, SQL and basic statistics. SQL is how analysts pull data out of databases, and statistics tells you whether a pattern is real or just chance. After that, pick one programming language, usually Python or R, and one charting tool such as Tableau or Power BI.
A small project teaches more than a long list of certificates. Take a public dataset, such as city bike-hire records or national exam results, ask one question, answer it and write up what you found in plain language.
A Master Program in Data Analytics is one way to build these skills in a set order, and it suits graduates who want more depth than self-study usually gives. Many courses cover statistics, databases, programming, machine learning and visualisation, though the content varies a lot, so read the module list before applying.
Is a master’s degree worth it?
It depends on where you start. A Master Program in Data Analytics makes the most sense if your first degree is in maths, statistics, engineering, economics or computing, or if you are changing fields and want guided practice with feedback. If you already work with data and learn well alone, a shorter course plus a portfolio may be enough. Neither route is wrong.
When comparing any Master Program in Data Analytics, check what the modules include, whether students work on real projects, who teaches them and which tools they use. Ask where graduates end up, and ask for actual job titles, not a placement percentage with no definition. Fees and entry rules differ between institutions, so confirm them directly.
Where does this leave you?
Tools in this field change every few years. The habit underneath does not: ask a clear question, check the data honestly and say what the numbers can and cannot support. Whether you learn that through self-study or a Master Program in Data Analytics, the habit comes first.
A simple readiness test is to pick a question that bothers you, find public data on it, and see whether the numbers agree with your hunch.
 Italiano
 English
 Arabic
 French
 Spanish
 Portuguese
 Deutsch
 Turkish
 Dutch
 Russian
 Romaian
 Portuguese (Brazil)
 Greek